Авторитетность издания
Добавить в закладки
Следующий номер на сайте


A performance evaluation methodology for energy efficient control system alternatives for MIMO systems
Abstract:The paper presents the methodology for selecting the most optimal alternative of an energy-efficient control system for a complex process system. The proposed methodology is may help to solve structur-al synthesis problems. Designing a control system is a set of interrelated operations aimed at achieving a specific outcome. The implementation of such project might involve uncertainties and risks, high costs, many stages and considerable time consumption, the need to have a well-coordinated team of executors, as well as no guarantee that there wiil be the expected outcome. The choice of a project management methodology and a strategy depends on the type of the process system and the project implementation objectives, the nature of uncertainties and risks, the possibility of using information technology and parallel design. Both project risks and design costs depend on the number of alternatives considered during design stages. Therefore, for project management it is necessary to use design process models that take into account the number of alternatives and their effectiveness at each stage of design work. In general, a design process can be described by a functional model in IDEF0 format supplemented by decision-making nodes. The method of evaluating the effectiveness of alternatives is based on the method of dynamic varia-tion, which assumes that each design stage has a formed group of various alternatives that begin to be developed in parallel. After each stage, there is an expert evaluation session with the following deci-sion on the significance of different alternatives in a group. As an example, the paper describes using the dynamic variation method for developing a control system for a six-section precision furnace for heat treatment of thermistor workpieces in the air. From a control point of view, it is a typical MIMO system with complex relations between inlets and zones.
Аннотация:В статье представлена методика выбора наиболее оптимального варианта системы энергосберегающего управления сложным технологическим объектом, которую удобно использовать в зада-чах структурного синтеза. Проектирование системы управления представляет собой совокупность взаимосвязанных операций, направленных на достижение конкретного результата. Особенностями таких проектов являются наличие неопределенностей и рисков, большие затраты, многоэтапность и значительное время выполнения работ, командный состав исполнителей, невозможность гарантированного получения ожидаемого результата. На выбор методологии и стратегии управления проектом оказывают влияние вид объекта и цели выполнения проекта, характер неопределенностей и рисков, возможность использования информационных технологий и параллельного проектирования. Как риск проекта, так и затраты на проектирование зависят от числа рассматриваемых альтернативных вариантов на стадиях проектирования. Поэтому для управления проектами необходимо использовать модели процесса проектирования, учитывающие число вариантов и их эффективность на каждом этапе проектных работ. В целом процесс проектирования можно описать функциональной моделью в формате IDEF0, дополненной узлами принятия решений. Основу методики оценки эффективности альтернативных вариантов составляет метод динами-ческой вариантности, суть которого в том, что на каждом этапе проектирования формируется группа разнообразных вариантов, которые начинают разрабатываться параллельно. После каждого этапа производится экспертиза и принимается решение о значимости отдельных вариантов в составе группы. В качестве примера в статье рассмотрено применение метода динамической вариантности для разработки системы управления прецизионной шестисекционной печью, используемой для термической обработки заготовок терморезисторов в воздушной среде, которая с точки зрения управления является типичным многомерным объектом, имеющим сложные взаимосвязи между входом, выходом и внутренними участками зон.
| Авторы: Муромцев Д.Ю. (mdjur@mail.ru) - Тамбовский государственный технический университет (профессор), Тамбов, Россия, Ph.D, Грибков А.Н. (GribkovAlexey@yandex.ru) - Тамбовский государственный технический университет (доцент), Тамбов, Россия, Ph.D, Шамкин В.Н. (shamkin-v@mail.ru) - Тамбовский государственный технический университет (доцент), Тамбов, Россия, Ph.D, Тюрин И.В. (tyrinilja@yandex.ru) - Тамбовский государственный технический университет (доцент), Тамбов, Россия, Ph.D | |
| Keywords: the energy savings, control strategies, optimal control, design stages, functional model, expert assessments, alternatives, dynamic variation, a control system, risk analysis |
|
| Ключевые слова: энергосбережение, стратегии управления, оптимальное управление, стадии проектирования, функциональная модель, экспертные оценки, альтернативные варианты, динамическая вариантность, система управления, анализ рисков |
|
| Количество просмотров: 5659 |
Статья в формате PDF |
The success of implementing an energy-efficient control system is largely determined by the ability to quickly and efficiently develop projects using a wide range of various methods and tools. They include information technologies of marketing, project and risk management, quality management and parallel project management, computer application, functional and information modeling, creation of intellectual archives of projects and multidisciplinary commands, information protection, project management standards, etc. [1–4]. A control system development project is a sequence of interrelated operations aimed at achieving a specific significant outcome. The specifics of such high-tech projects includes uncertainties and risks, high costs, multi-staging and considerable time consumption, teamwork, lack of guaranteed results, the need to use computer technologies and parallel design methods [5]. Any project considered as a process has a life cycle. The main stages or phases of a project life cycle include motivation and concept formation, research and development (product planning), design, production, implementation, and completion. The results of the work at one stage are used to perform the next one. After completion of each project phase, key decisions are made. Project management involves a number of procedures, such as management, planning, distribution and regulation of resources (labor, material, equipment) taking into account various constraints (technology, budget and time) at all stages of the project life cycle [1]. The most important procedure is making key design decisions in formulating goals, forming a team, approving a work plan, project feasibility assessment, etc. In general, the project management problem includes the following initial data: - information relating to the initiation (motivation) of a project kickoff; - design process restrictions (time, resources, etc.); - basic requirements for the subject (object) of the design; - available resources for project execution. In order to solve the problem it is necessary: - to select the methodology of the project implementation; - to create a team of workers; - to carry out design stages making sure that the possibility of obtaining the desired outcome is high enough, or stopping work in a timely manner to avoid unnecessary costs. The choice of a project management methodology and strategy depends on the system type and project implementation goals, the nature of uncertainties and risks, the possibility of using information technologies and parallel design [6, 7]. Risks and costs are the most important components that must be constantly taken into account at all stages of the project life cycle. A project risk is usually understood as the probability of not achieving the project objectives and the expected results. The risk depends on a big number of factors due to insufficient information or a random nature of the phenomena that affect the project success. These factors include the instability of an economic and political situation, actions of competitors, errors of production personnel, etc. Project costs take into account all types of activities and resources used in the monetary valuation, they can be determined by the method of functional cost analysis. Depending on project characteristics and a situation in the company, the following main project management tasks are possible: 1) minimizing the risk while limiting the costs; 2) minimizing costs while limiting the amount of risk; 3) meeting the cost and risk constraints. Both project risks and design costs depend on the number of alternatives considered at the stages of a project life cycle. The main way to reduce the risk is to increase the number of alternatives, however the costs increase in this case. Therefore, in project management, it is necessary to use design process models that take into account the number of alternatives at each life cycle stage. We consider the cost and risk models of a project under the following assumptions: – the project life cycle includes a pre-design and design stages; – the number and composition of the options under consideration in the i-th and j-th stages may differ, i.e. – total project costs can be considered as the sum of costs at individual stages of a life cycle; – the project risk is estimated by multiplying probabilities of complex events. If many alternatives Vj are developed at the j-th stage, then total project costs zq are equal to
where z0 is pre-project costs; zj(ui) is the cost of the work on the alternative ui at the j-th stage; When the costs of all j-th stage options are the same, tthen formula (1) has the form In general, cost components Assuming that the events involved in the successful execution of work on the alternatives and stages are independent, we can use the following formula for determining the project risk Qp:
where q0 is the pre-project stage risk; qj(ui) is the risk of alternative ui at the j-th stage. If the risks at the j-th stage are similar for all the alternatives ui Î Vj, then in this case the formula (2) will be written as
Formulas (1), (2) are the basis of a design process model that takes into account various options during project life cycle stages. These formulas show that if the number of alternatives considered increases, the costs zq increase proportionally to the number of options. The dependence of risk Qp on the number of alternatives wj at the j-th stage of the project is more complex. When the number of alternatives increases, the project risk decreases in dependence that is close to hyperbolic. Dynamic variation method The main idea of the dynamic variation method is as follows [2]. Each design stage has a formed group of diverse alternatives that are developed in parallel. Each stage finishes with the expert evalu- ation and a decision on the significance of individual alternatives in the group.
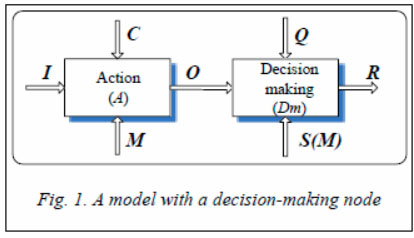
According to Fig. 1, the basis of the modified functional model of a process description at various stages of design consists of nodes from two blocks: an action block (A) and a decision block (Dm), as well as inputs (I), outputs (O), control (C), mechanisms or resources (M), a criterion and a method (Q), experts (S) and solution results (R). The dynamic variance method is based on the following provisions: 1) several possible alternatives are considered at each project stage; 2) after completing each stage, the group of these alternatives may change; 3) the probability of achieving the desired outcome is considered as the main criterion when comparing alternatives; 4) for each life cycle stage, there are characteristic signs of the formation of alternatives, which can be considered as a principle of system operation, its design, taking into account possible functioning states, etc.; 5) the exclusion of “unsuccessful” alternatives is conditional; if necessary, you can return to them and continue their development; 6) after receiving new information, the initial data of a design problem during a project life cycle is adjusted, and part of the calculations is revised (based on feedback). Improving the efficiency of design when using the dynamic variation method is achieved by: - considering several alternatives; - changing the composition of a group of alternatives according to the results of implementing individual stages; - carrying out analysis of alternatives and making decisions after each stage; - using additional information received during the design process, for example, about the characteristics of a similar product from potential competitors; - revising previously taken decisions based on new information relevant to the project; - applying a set of particular criteria when comparing alternatives. The considered method takes into account two aspects of a project dynamics. First, the number and composition of alternatives may vary at each stage. Second, during the design time, various types of parameters related to task formulation and goals formulation can be changed due to the information flow from the external environment, for example, the values of the key components of a design object, their importance, etc. The application of the dynamic variance method is considered in the following example. The control system of a precision six-section furnace used for heat treatment of thermistor billets in air is considered as an object of design. From a control point of view, a furnace is a typical MIMO system with complex interrelationships between the input, output, and internal portions of zones. The rationale for the project is high energy consumption, a high rejection rate and relatively low reliability of furnace heating elements.
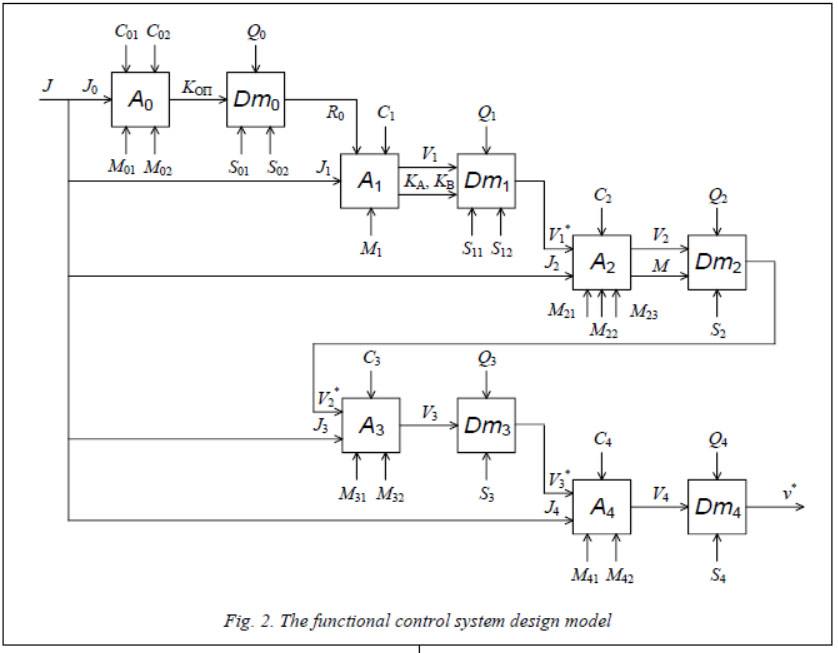
Let us consider in detail each design stage, i.e. actions Aj and decision making Dmj, Stage 1. Block A0 is responsible for implementing a pre-project stage. Based on the available information J0, the control system design reference point is developed in the form of an array of key project components (KPCs) When designing KPCs, the controls C01, C02 include technical and regulatory documentation for the furnace and the procedure for the development of KPCs, while the main resources include marketing staff M01 and network resources M02. Taking into account the uncertainty in the market for finished products, two situations of furnace operation are possible: normal operation h1, i.e. the furnace is loaded for more than 50 % of the calendar time, and functioning h2 at low (< 30 %) workload. These situations are characterized by the following values: h1 : p(h1) = 0,6, Krp(h1) = (4; 6; 5; 2); h2 : p(h2) = 0,4, Krp(h2) = (5; 8; 5; 2,5). Thus, the output of the A0 block contains values Krp(h1), p(h1), i – 1, 2. Block Dm0 (Fig. 2) is designed to make decisions on the continuation of works. This requires an assessment of the probability Po of a successful project implementation. To do this, we calculate the probability Poi of the correct selection of operating indicators, the weights of the components (c1, c2, c3, c4) and the shares dk(h) of arrays Krp(h) that have sufficient grounds for improvement. These values are determined as averages based on the expert statements (S01) and numerical processing of the results (S02) on a computer according to the evaluation procedure Qo. In our case Poi = 0,95; c1 = 0,35; c2 = c4 = 0,3; c3 = 0,05; dk(h1) = c1 + c2 + c4 = 0,95; dk(h2) = c1 + c4 = 0,65;
and the probability of successful project implementation Calculation dk(h1) considers that there are prerequisites for achieving values The resulting probability Po = 0,79 (result R0) is quite high and the work should be continued, while the risk is about 21 %. Stage 2. The block A1 (Fig. 2) includes developing the concept and forming a set of alternative control systems. It provides input information J1 about models, strategies, and hardware. The output presents a variety of alternatives V1 and the values of the KPCs arrays for two groups of alternatives – KA and KB. The technical documentation is considered as controls R0 and C1, while the main mechanism M1 is represented by the automation service personnel.
Fig. 3 shows that the set V1 consists of eight options that differ, apart from the type of reengineering (A and B), in the strategies of implementing optimal control (SW – software, PZ – positional with phase coordinate feedback) and hardware (PC – computer, CT – controller). Branch A of the alternatives subset ( Alternatives of branch B provide creating a new optimal control system for heating (cooling) modes of the furnace and temperature stabilization. Such options refer to “hard” reengineering. It should be noted that the values of KPCs arrays in the form of “triple” assessments – the lower bound (Kl), the most likely value Block Dm1 (Fig. 2) is necessary for expert evaluations of “triple” alternatives Possible outcomes of decision making at this stage are: – groups of alternatives VA and VB remain for further consideration if
– only a set of alternatives
– only a set of alternatives
– groups VA and VB are rejected to create new alternatives if $ i Î {e, d, r, p}:
– project work is terminated as unpromising if " i Î {e, d, r, p}:
where Based on values
The decision is based on the obtained values Let condition (3) be satisfied and
Based on risk assessment and given that the cost of the next work stage slightly depends on the number of considered alternatives, the decision maker considers it appropriate to continue research if V1 = VA È VB. Stage 3. The purpose of A2 block (Fig. 2) is to carry out a set of research projects to identify the dynamics model, to identify the links between the input and output variables, and to determine the optimal modes. A set of alternatives V1 and information J2 are sent to the input. The control C2 is a method for model identification. Resources M21 are the equipment and instruments for conducting experiments, M22 is a software module for the identification of dynamics models, M23 is personnel. There is the resulting dynamics model M and the formed set of alternatives V2 at the output. The set of alternatives V2 is the union of two subsets: V2 = VA È VB. In addition, we highlight the factors that significantly affect the indicator kd. However, at the same time we have found no factors that have a close relationship with the component h1 : p(h1) = 0,6, Krp(h1) = (5; 8; 2); h2 : p(h2) = 0,4, Krp(h2) = (6; 10; 2,5). The composition and values of the array com- ponents The decision-making block Dm2 (Fig. 2) is intended for comparative analysis of subsets of alternatives VA, VB and assessing risk values for them. Here, the input parameters are the dynamics model M and a variety of options Using values Thus, according to the results of the expert evaluation, the number of alternatives considered in the next stages does not change. Stage 4. Block A3 of the draft design stage (Fig. 2) analyzes the optimal control in order to determine the possible types of optimal control functions and control implementation strategies, and also assesses the magnitude of the energy efficiency effect. A set of alternatives Possible values of the energy performance effect for alternatives In block Dm3 (Fig. 2), a decision is made at the completion of the draft project. The input of the block receives control algorithms for alternatives In order to make a decision at this stage, wthere is the effectiveness matrix for the main component (i.e. the percentage of energy savings ke). Table 1 lists the average values ke for three functioning states: – H1 – one product range is produced with a stable network voltage; – H2 – one type of product is produced under possible voltage fluctuations; – H3 – there are different types of produced products, which requires a change in temperature modes. Table 1 Energy performance cost matrix
The data in Table 1 are processed by the methods of equal probability (criterion qp), Hurwitz (qH), Shanyavsky (qS) and Wald (maximin) (qW). The calculated values of the criteria (with a weighting factor c = 0,5 for the criteria of Hurwitz and Shanyavsky) are shown on the right side of Table 1 [11]. Taking into account that the next stage of technical design requires considerable labor costs, it is necessary to significantly reduce the number of system options. The efficiency matrix (Table 1) corresponds to the matrix of missed opportunities (Table 2) for determining the Savage criteri- on [12]. Table 2 Matrix of missed opportunities
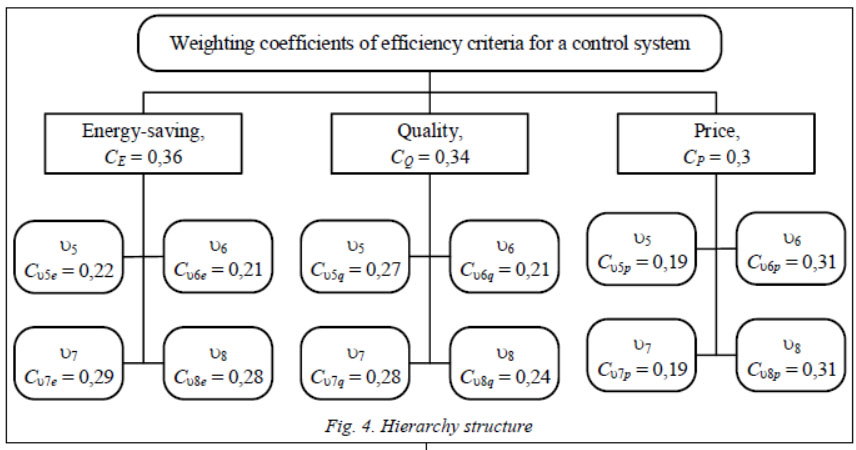
According to the selected criteria, we should consider the most preferable alternatives u Î {VB, SW È VB, PZ } (Fig. 3). Thus, the number of project alternatives is reduced to four. Stage 5. Block A4 is the technical design stage (Fig. 2). It is designed to develop algorithmic and software of the automated control system for the alternatives selected at the previous stage. The input of the block receives information and alternatives This stage includes developing a version of a control system that is suitable for the final implementation. Using the capabilities of any special SCADA system, a full algorithmic support and software is developed for the automated control system alternatives u5–u8. It should be noted that the alternatives u6 and u8, which use a computer, have greater functionality than alternatives u5 and u7 (on the controllers). However, the latter alternatives are cheaper; the payback period is shorter for them. Alternatives u7, u8 have a slightly higher accuracy of compliance with process regulations. Block Dm4 of an expert evaluation session (Fig. 2) is designed to select one of the four options for practical implementation. Input information are control algorithms for alternatives u5, u6, u7, u8. The output of the block recevies the documentation for the selected option. The control Q4 is based on the decision-making method under partial uncertainty; the resources
The calculation of the alternatives ranking shows that R(u5) = 0,228, R(u6) = 0,24, R(u7) = = 0,2566 and R(u7) = 0,2754. Thus, the alternative u8 is chosen as the optimal one as it uses a positional strategy and a technical tool – the controller. Software implementation
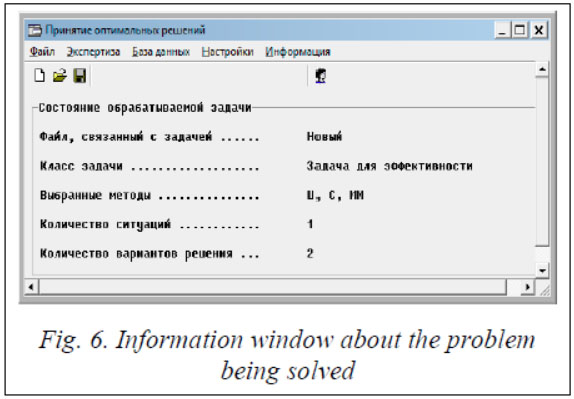
A methodology for constructing hybrid expert systems designed for solving management problems by multidimensional energy-intensive objects is implemented in the ESEM. The core of the expert system is the knowledge base, which contains knowledge in the field of energy-saving management. The knowledge base includes both general knowledge and information about particular cases. The knowledge base of the ESEM uses both theoretical methods of optimal energy-saving control and experts’ knowledge. Users and experts interact with the ESEM through a user interface. It is also planned to supplement it with the results of the In the automated mode, the ESEM solves the direct and inverse problems of energy-saving control. It requires using the methods that allow visualizing the progress and the results obtained for a designer of control systems on the base of a significant reduction in the dimensionality of the arrays of variables and parameters involved in solving problems.
Conclusion The considered example shows that the use of the dynamic variance method expands the possibilities of designing control systems for MIMO high-tech systems by redistributing the composition of alternatives at the life cycle stages, making fuller use of incoming information and changing decision-making methods as the uncertainty in design decreases. Acknowledgements. The study has been financially supported by a grant from the Russian Foundation for Basic Research, projects no. 17-0800457-a and no. 18-0800555-a. References 1. Deshko I.P. Informational approach to modeling. Educational Resources and Technologies. 2016, no. 5, pp. 21–26 (in Russ.). DOI: 10.21777/2312-5500-2016-5-21-26. 2. Muromtsev Yu.L, Muromtsev D.Yu., Pogonin V.A., Shamkin V.N. Conceptual Modeling in the Tasks of Economic Efficiency, Competitiveness and Sustainable Development. Tambov, TSTU Publ., 2008, 176 p. 3. Tsvetkov V.Ya. Conceptual model of the innovative projects efficiency estimation. European J. of Economic Studies. 2012, vol. 1, iss. 1, pp. 45–50. 4. Ryzhov A.A., Kotsyuba K.Yu. Analysis of the functional modeling method. Modern Trends in the Development of Science and Technology. 2017, no. 1-1, pp. 118–121 (in Russ.). 5. Tsyzdoev M.B., Konashenkova A.Yu., Ivanov I.A. Development of the structure of an automated energy control system. Innovation, Information and Communication Technologies. 2017, no. 1, pp. 611–614. (in Russ.). 6. Zhuravlev S.I., Matvienko Yu.A., Titov M.Yu. Using the methods of the theory of schedules to solve project management problems in the creation of automated control systems. Industrial Control Systems and Controllers. 2017, no. 11, pp. 50–53 (in Russ.). 7. Morris P.W.G. The Management of Projects. 1997, 376 p. 8. Zvonov A.O., Yanishevskaya A.G. Artificial intelligence methods of in automating design solutions. Automation and Modern Technologies. 2013, no. 10, pp. 18–21 (in Russ.). 9. Tusar T., Filipic B. Visualization of Pareto front approximations in evolutionary multiobjective optimization: a critical review and the prosection method. IEEE Trans. on Evolutionary Computation. 2015, vol. 19, no. 2, pp. 225–245. 10. Zhu C., Xu L., Goodman E.D. Generalization of pareto-optimality for many-objective evolutionary optimization. IEEE Trans. on Evolutionary Computation. 2016, vol. 20, no. 2, pp. 299–315. 11. Brodecky G.L. On the issue of decision quality in multi-criteria optimization of queries using the Hurwitz method. Quality Management. 2012, no. 2, pp. 108–116 (in Russ.). 12. Labsker L.G., Yashchenko N.A. On the question of proving a theorem on the structure of a set of strategies optimal by the Wald–Savage criterion. Science and World. 2013, no. 1, pp. 158–167 (in Russ.). 13. Belton V., Stewart T.J. Multiple criteria decision analysis: an integrated approach. Boston, Cluwer Publ., 2003, 372 p. 14. Barzilai J. Preference function modelling: the mathematical foundations of decision theory. Trends in Multiple Criteria Decision Analysis. M. Ehrgott, J.R. Figueira, S. Greco (Eds.). NY, Springer Publ., 2010, pp. 57–86. Литература
| ||||||||||||||||||||||||||||||||||||||||||||||||||||||

 (6)
(6) (7)
(7) (8)
(8)

| Постоянный адрес статьи: http://swsys.ru/index.php?page=article&id=4626&lang= |
Версия для печати |
| Статья опубликована в выпуске журнала № 3 за 2019 год. [ на стр. 486-495 ] |
Возможно, Вас заинтересуют следующие статьи схожих тематик:
- Информационная среда проектирования систем ресурсосберегающего управления промышленным оборудованием
- Методика оценки эффективности мероприятий по развитию технологии открытых систем
- Инфологические и структурные модели подсистемы управления материально-техническим обеспечением учебного процесса
- Интеллектуальная система управления и мониторинга газовой котельной
- Система управления предприятием
Назад, к списку статей